Understanding how visitors engage with your virtual tours is key to creating experiences that truly connect.
WP VR’s Analytics feature gives you precise insights into which scenes attract the most attention and which hotspots visitors interact with the most. With this data, you can fine-tune your tours, highlight your best features, and make informed decisions that boost engagement and keep users exploring longer.
Analytics isn’t just numbers — it’s your guide to making every virtual tour more effective and engaging.
**It is a Pro feature, so make sure WP VR Pro plugin and the license is activated on your site
How to Access Analytics #
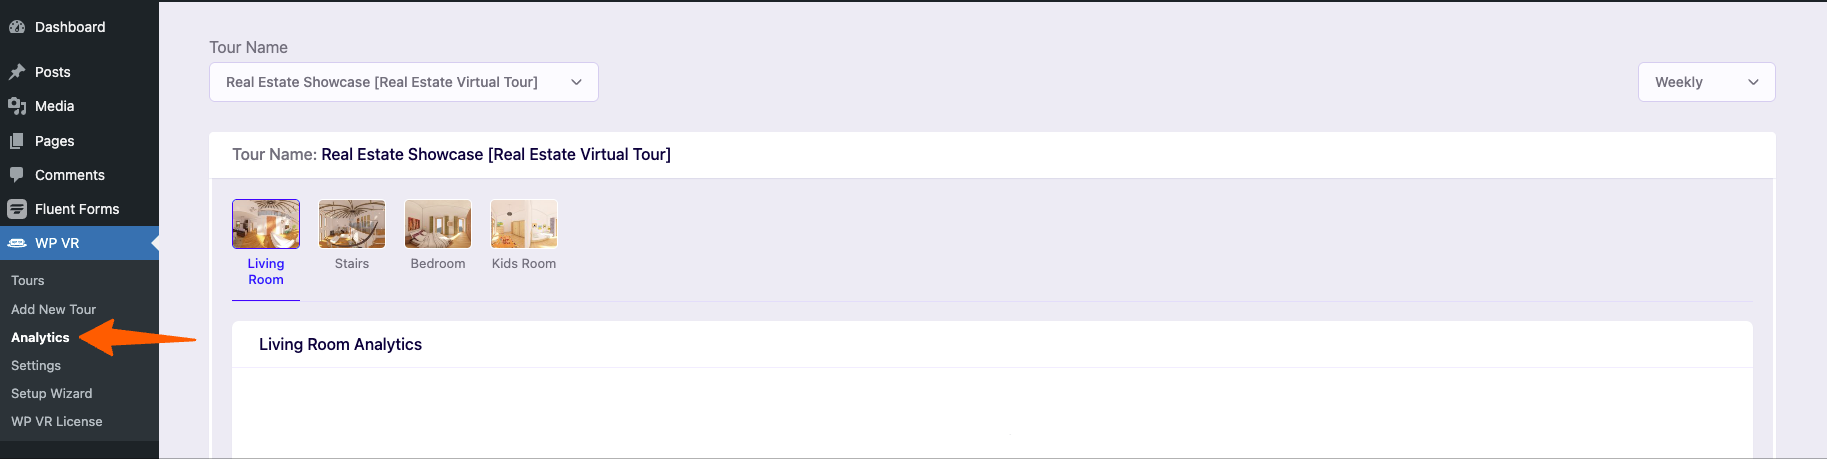
1. Open your WordPress Dashboard and navigate to the WP VR menu and select Analytics.
2. To see the analytics of a particular tour, use the Tour Name dropdown to select a published tour. Only published tours appear in this list.
3. After selecting a Tour you’ll see all the Scenes and Hotspots are listed like the screenshot below.
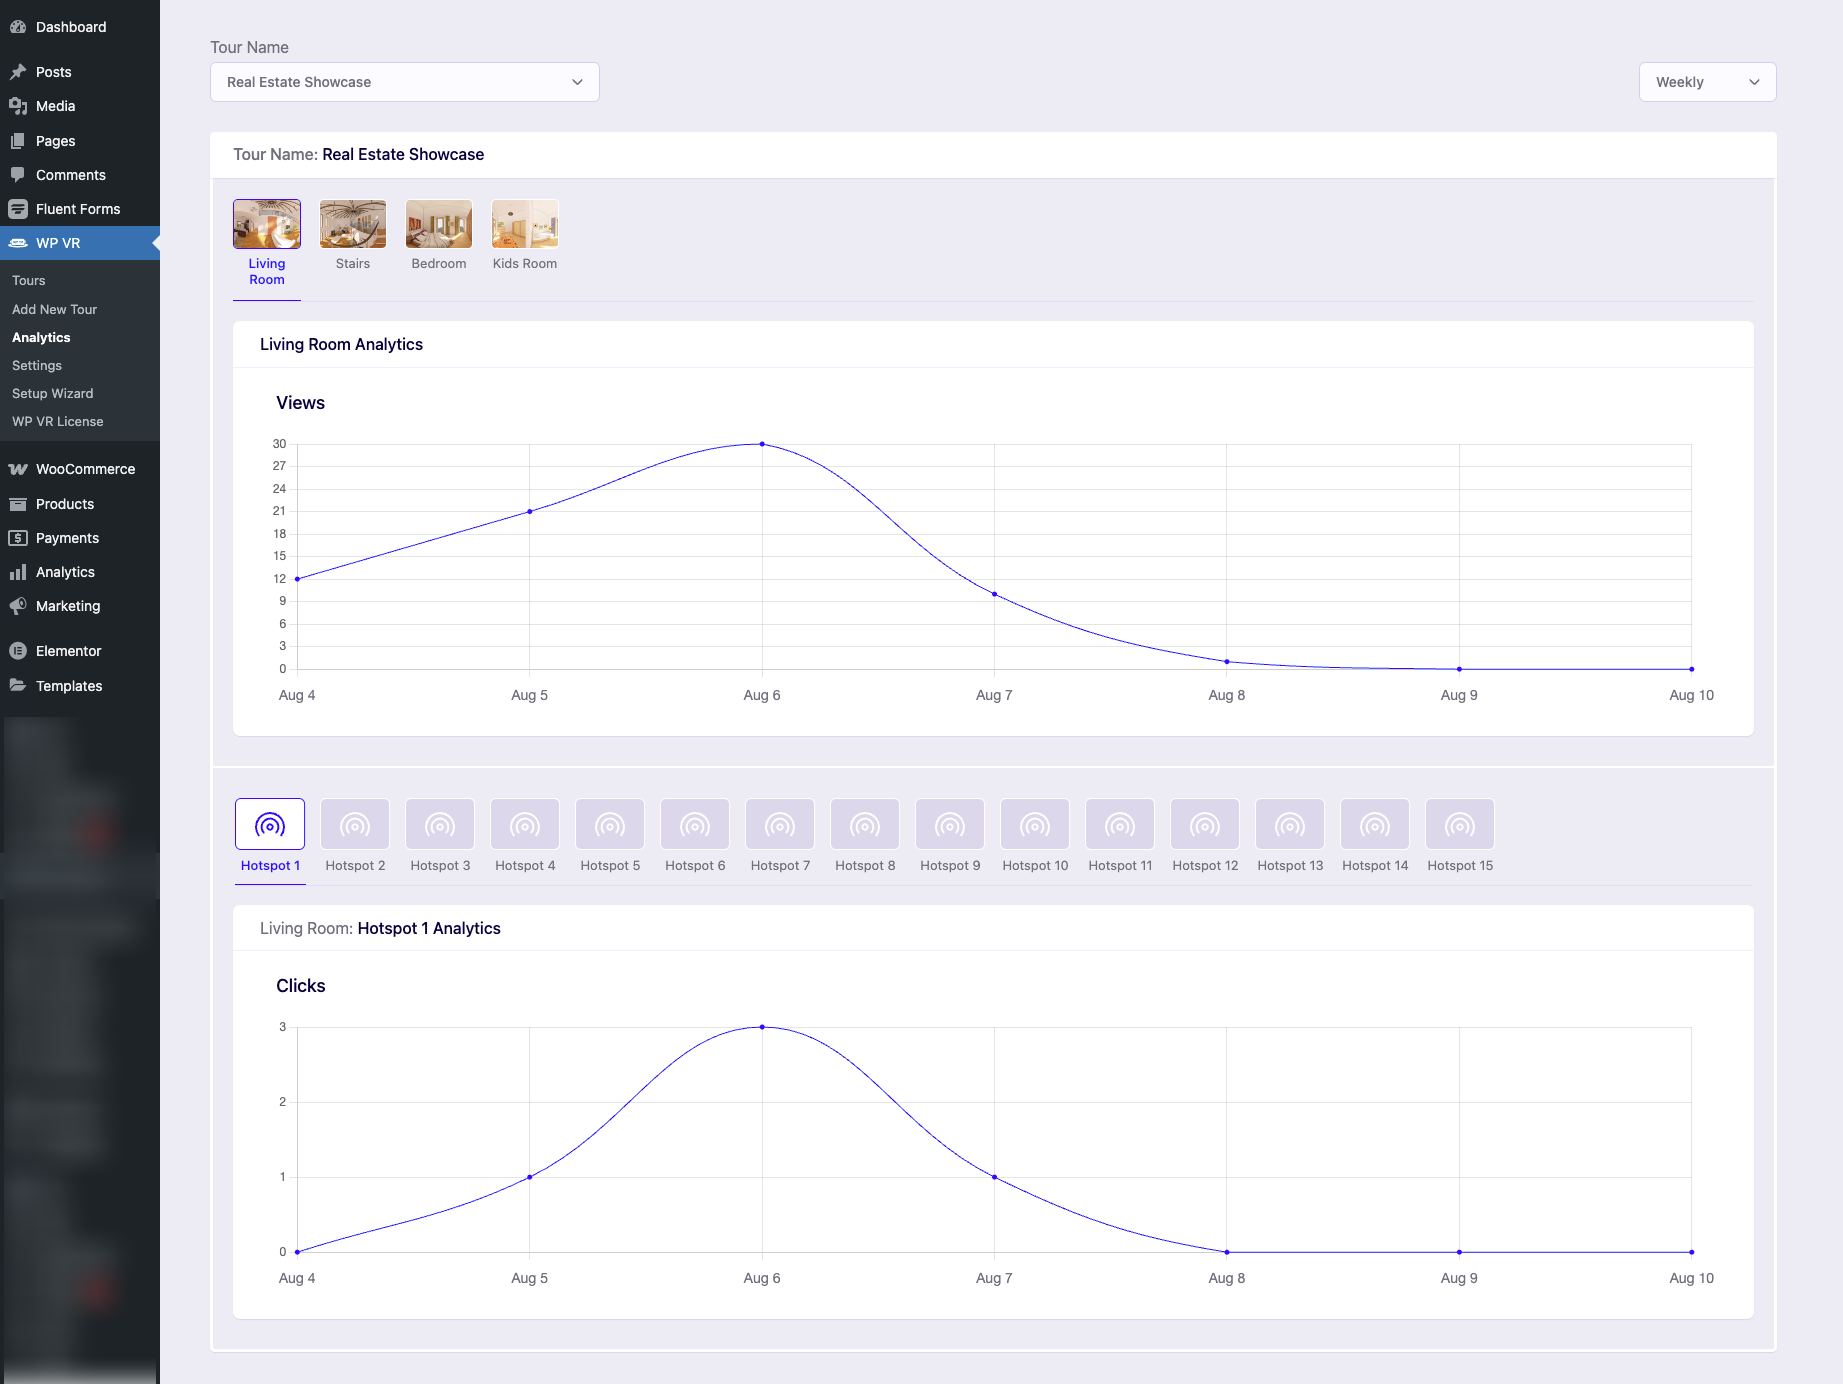
4. Now you can pick a scene to view detailed analytics for that scene. Similarly you can also a pick Hotspot and view detailed analytics for that Hotspots.
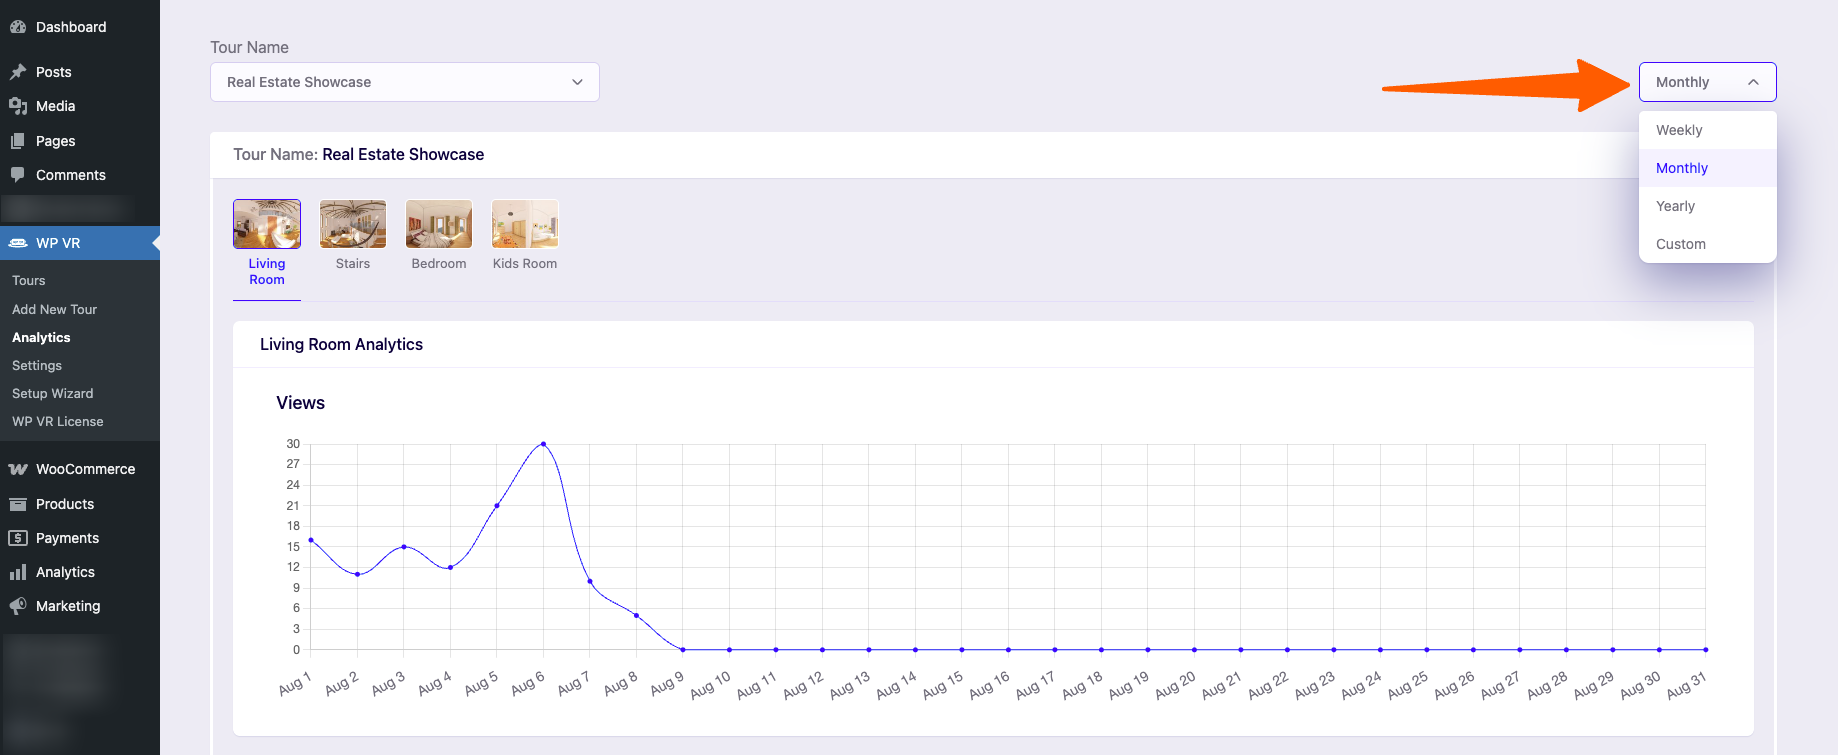
5. You can also select the specific time period from the Time filter dropdown.
What Analytics Shows You #
- Scene Views: Number of times each scene has been viewed over your chosen time period.
- Hotspot Clicks: A list of hotspots in the scene, shown in order, with how many times each was clicked.
- Time Filters: Choose between Weekly (default), Monthly, Yearly, or a Custom date range to see data for specific periods.
By regularly using WP VR Analytics, you’ll gain valuable insights that help you create more engaging, effective virtual tours — turning data into smarter decisions every step of the way.
That’s how easy it is to check the Analytics of your Tour performance.