Once you have the abandoned cart recovery campaign in place, now it’s time for you to observe the performance of the recovery campaign.
You can check the in-depth analytics of the abandoned cart recovery campaigns from the Reports section.
Using these data, you can plan on improving your email copies, and keeping track of how much more revenue you are making, that you were losing all this time.
01. Go To Reports #
Go to Dashboard > Cart Lift and the Reports tab is the first thing you will see.
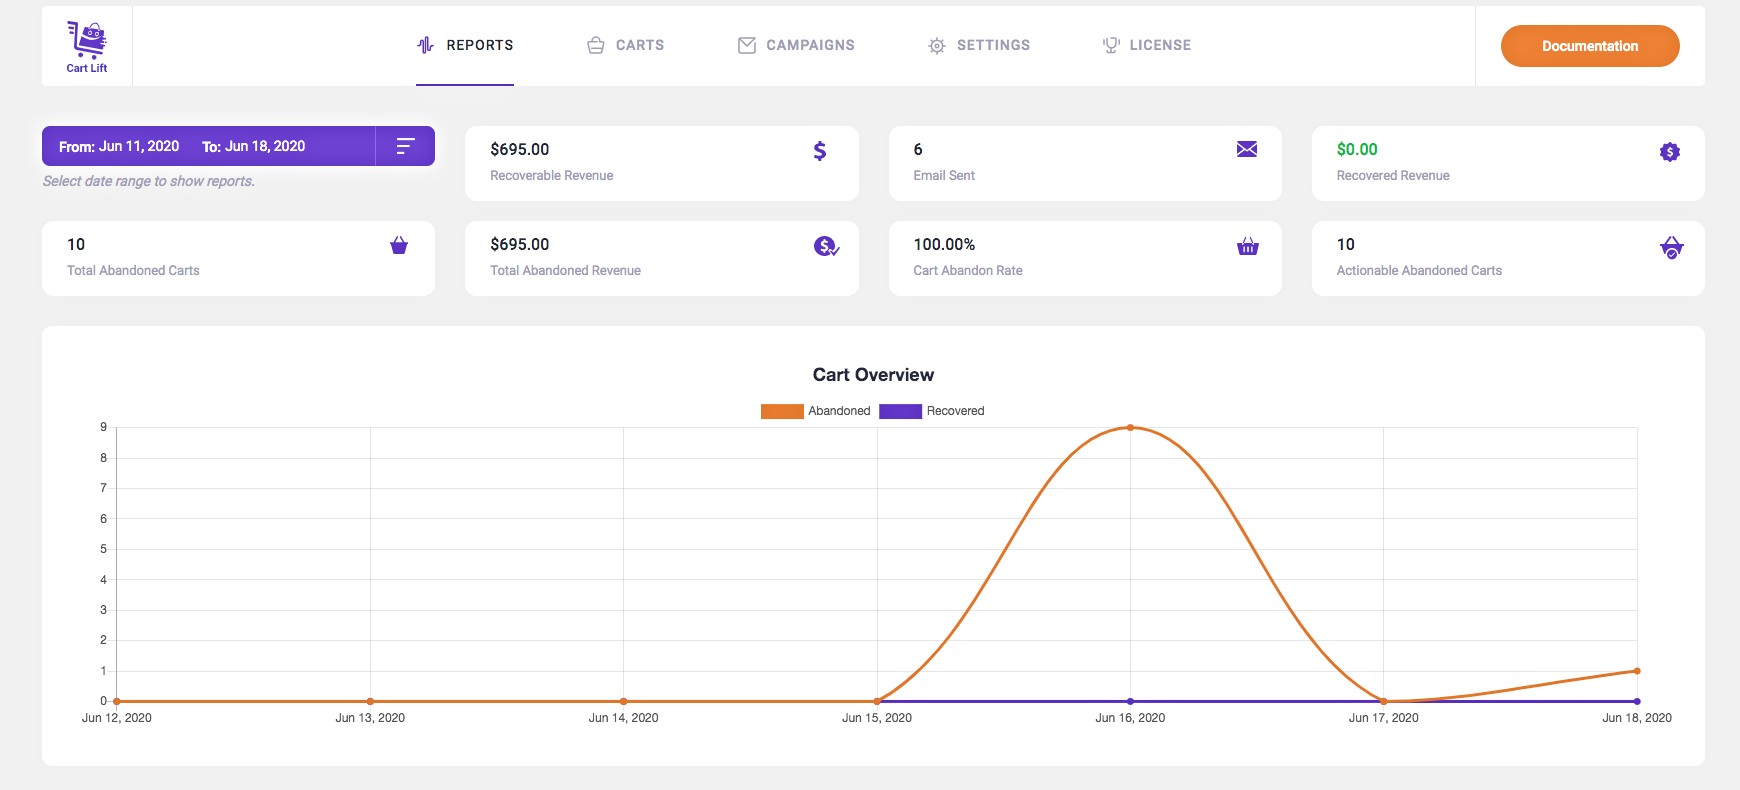
Here you will get all the data and updates about your abandoned cart recovery campaigns.
02. View Report Based On Range Of Days #
On the top right side, you will get the option to select a start and end date to indicate the range of days for which this report will be shown.

Click on From to set a start date, and To to set an end date to set a range and the report will update.
03. Observe Analytics #
Once you’ve set the range, all the analytics will be shown for that range.
You will get calculated values of the following:
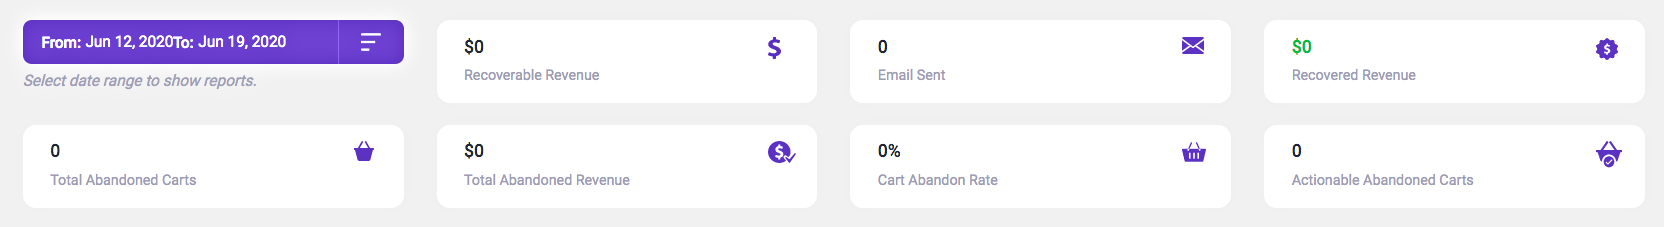
• Total Abandoned Cart –
It is the total number of carts that were abandoned in your shop within the selected date range.
• Recoverable Revenue –
This is the total amount of potential revenue that is possible to win back using the recovery campaign.
**It excludes the costs of the carts which cannot be recovered, i.e., the customer’s data is not available to reach back for recovery.
• Total Abandoned Revenue –
It is the total amount of potential revenue that you lost due to abandoned carts. It is basically a summation of the total costs of all the abandoned carts on your store..
• Email Sent –
This is the number of abandoned cart recovery emails that have been sent during the selected date range.
• Cart Abandon Rate –
It is the percentage of people that abandoned your site after adding products to the cart.
• Recaptured Revenue –
Here, you will find the total potential revenue that was successfully recovered using the abandoned cart email campaigns, i.e., the extra revenue you earned thanks to the recovery campaign.
• Actionable Abandoned Carts –
This is the number of abandoned carts for which you can run your abandoned cart recovery campaign, i.e., the customer data is available to reach out to them.
04. Compare Performance Charts #
Just below the data, you will see a chart to compare your performance.
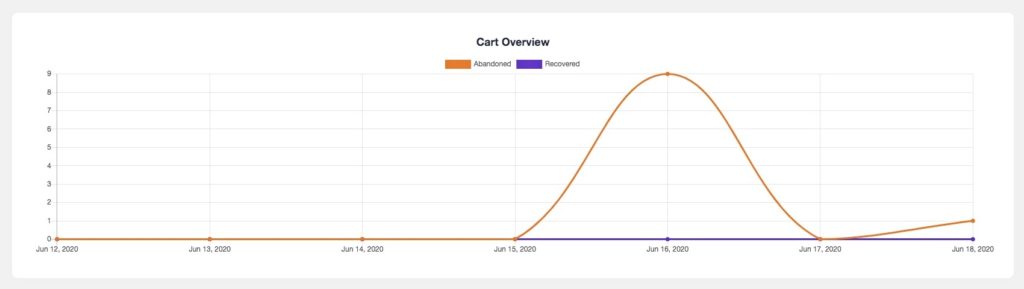
Here, the orange line will indicate the number of abandoned carts that you faced and the purple line will indicate the number of abandoned carts that were recovered.
These analytics are necessary for you to take important decisions.
For example, if you are having more than 75% abandoned cart rate, then you must look into the matter and take steps to reduce that.
Also, if you see a lot of emails were sent but the number of recovered carts are still low, then you might need to change your email copy, or the subject line.
Make use of the analytics to get the maximum outcomes.